Friday, May 03, 2024

The 2024 World Press Freedom Rankings

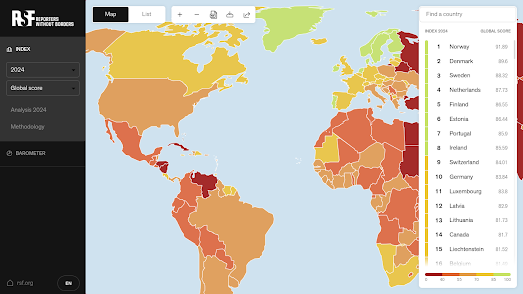
global map showing countries colored based on their press freedom rankings

Reporters Without Borders (RSF) has released its annual World Press Freedom Index report. The 2024 report analyses and maps the levels of press freedom in countries around the world. The map ranks the level of press freedom in countries based on five different indicators. Norway, Denmark and Sweden respectively lead the 2024 rankings.

The United States has fallen to 55th overall. Once seen as a model of freedom of expression the United States continues to fall down the world rankings for press freedom. The RSF reports that in America, 'a growing interest in partisan media threatens objectivity, while public confidence in the media has fallen dangerously'. The RSF also notes that President Biden has personally been criticized for "failing to press US partners like Israel and Saudi Arabia on press freedom".

According to RSF the biggest threat to press freedom in the last year were politicians and political authorities. The organization uses five indicators to compile its country press freedom rankings. Of these five indicators the political indicator has fallen the most, reflecting a trend where many political authorities are in fact trying to control the media and suppress news and information instead of protecting and guaranteeing press freedoms.

The RSF points to a "clear lack of political will on the part of the international community to enforce the principles of protection of journalists" linking this directly to the more than 100 Palestinian reporters who have been killed by the Israel Defence Forces in the last year.

global map with countires colored to show the numbers of journalists imprisoned in 2023

According to the Committee to Protect Journalists' annual report, Attacks on the Press, nearly 75% of journalists killed around the world in 2023 died in Israel’s war on Gaza. You can explore the results of the CPJ's report for yourself on the Attacks on the Press 2023 interactive map. This story map takes you on a guided tour of the report's findings into the continuing attacks on the liberties and lives of journalists around the world last year.  

Israel and the Occupied Palestinian Territory saw by far the largest number of journalist killings last year. Of the 99 journalists killed around the world in 2023, 72 were Palestinians. China, Myanmar, Belarus, Russia, and Vietnam were responsible for jailing the most journalists, many of them without trial.

screenshot of Mapping Media Freedom's European map of alerts of threats to the media

Mapping Media Freedom is another organization which is dedicated to tracking attacks on the free press. Mapping Media Freedom maps threats to the media throughout the European Union and neighboring countries. It is a joint initiative from the Index on Censorship, the European Federation of Journalists and Reporters Without Borders. The map uses clustered markers to show the locations of crowd-sourced reports of threats, violations or limitations faced by journalists, newspapers or other media.

You can filter the reports shown on the map by location, date range or category. The categories include different types of censorship and limits to press freedom. They also include the option to filter by gender, type of journalist and the source of the threat to media freedom.  

Thursday, May 02, 2024

Whose Plaque is it Anyway?

illegible plaque on the side of a bridge over Bow Creek
For over 20 years I've wondered what the text on this plaque in East London actually says. This morning I finally decided to explore a few memorial interactive maps to see if I could discover why this bridge over Bow Creek has a plaque, and what the text on the plaque actually says. 

I thought it might also be a good opportunity to provide a little round-up of the growing number of memorial maps. So here are the cartographic references for my plaque search, and a couple of other memorial maps thrown in for good measure:

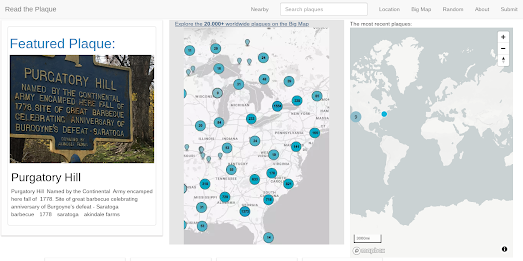
Read the Plaque has mapped over 20,000 plaques located around the world. As well as searching for plaques by location you can search Read the Plaque by tag or by the most recently submitted plaques. 

When you select a plaque on the map you can view its dedicated page, which includes a photo of the plaque and a transcription of the text on the plaque. A map also shows the plaque's exact location and the location of nearby plaques.

Anyone can submit a historical plaque to Read the Plaque by taking a photo of the plaque and marking its location on an interactive map.

screenshot of Read the Plaque's world map of plaques

The Historical Marker Database records the locations of permanent outdoor historical markers and commemorative plaques. The database allows you to explore the locations of markers and plaques around the world which are used to mark sites of historical importance. 

If you click on the 'near you' option and share your location with the Historical Marker Database you can view an interactive map of your nearest 100 markers. There is also an option to search for your nearby markers by topic (e.g. war, architecture, landmarks etc).

Open Benches is an interactive map of 28,592 memorial benches located around the world. These are benches which have been dedicated to the memories of local individuals, usually with a loving plaque.

London Remembers has an interactive map of over 7,000 plaques, monuments, statues, fountains which have been erected in the capital in order to commemorate a person or an event.

KilRoyTrip is an interactive map of World War II memorials in Normandy. It provides a fantastic guide to anyone visiting the region who is interested in the D-Day landings and the liberation of France. If you share your location with KilRoyTrip the map will show you the locations of your closest WWII memorials. Click on a marker and you will be taken to the selected memorial's dedicated place in the KilRoyTrip database. Each memorial entry in the database includes a description of the memorial, photographs of the memorial and links to other nearby memorials. 

close up of a plaque identical to the plaque on Bow Creek bridge
© Copyright Stephen Craven and licensed for reuse under this Creative Commons Licence .

After only a few minutes of searching I managed to find this memorial entry on Read the Plaque. This isn't the plaque on the bridge over Bow Creek but it is nearby and also attached to the Norther Outfall Sewer so I am almost 100% convinced that it features the very same text memorializing the construction of Bazalgette's magnificent Victorian sewage system.

Wednesday, May 01, 2024

The Global Inflation Tracker

an animated map showing inflation rates in countries around the world over the last three years

The Council on Foreign Relations new Global Inflation Tracker provides an intriguing guide to trends in prices across the world since the 1990s. On the map almost 200 countries around the world are colored to show their year-over-year rate of inflation (the darker the color the higher the rate of inflation).

If you animate through the data on the map it is striking how stable inflation rates in the Western economies were for a long twenty year period at the start of this century. During this period most western economies, including the US, achieved inflation rates consistently below 5%.

In 2020 the Covid pandemic started and in 2022 Russia invaded Ukraine. Both these factors have probably played a large part in ending this period of economic stability. Since 2021, inflation rates have risen globally, probably due to factors such as the supply chain disruptions caused by the pandemic and the escalating energy costs arising from Russia's invasion of Ukraine and the subsequent imposition of economic sanctions on Russia by Western nations.

The Global Inflation Tracker includes a drop-down menu which allows you to view the inflation rates for different sectors, eg for energy, food, clothing, housing etc. If you select to view the rate of inflation in energy you can view the huge rise in energy prices experienced since Russia's invasion of Ukraine. On a more optimistic note you can see how in recent quarters in most Western economies there has been a marked deflation in energy prices. This in turn seems to be contributing to an overall fall in inflation rates in many countries.

Tuesday, April 30, 2024

Live From Space

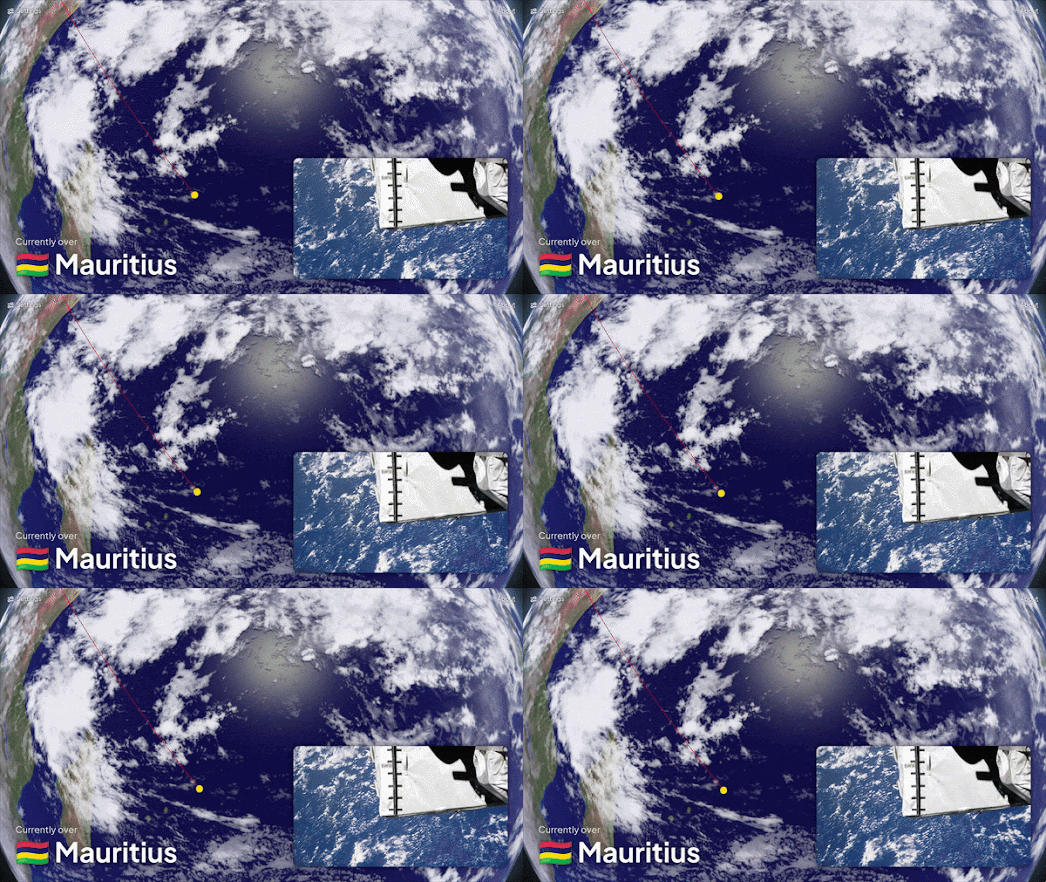
animated globe showing the position of the ISS next to a live stream of the Earth from the ISS

The 3D ISS Tracker shows the position of the International Space Station above the Earth in real-time. It also shows a stunning live HD view of Earth as seen and broadcast from the ISS. 

The position of the ISS is indicated by the little yellow dot slowly circling the Earth If you zoom out on the globe you can also view the current positions of the sun and moon. The cloud layer shown on the 3D model of the Earth is also shown in near real-time. 

The near real-time cloud layer is created from EUMETSAT data. The cloud layer is updated eight times a day, every three hours. If you want to use the cloud layer it is available from Live Cloud Maps. The 3D globe in the visualization uses Globe.gl, a 3D globe library which uses ThreeJS/WebGL for the 3D rendering.

If you want to spot the ISS for yourself then James Darpinian's See a Satellite Tonight can tell you when the International Space Station is flying over your house. It can also tell you where to look in the night sky so that you don't miss the ISS when it flies over your location.

Share your location with See a Satellite Tonight and you can view an interactive 3D Cesium Earth, showing your current location highlighted on the globe. The globe also shows the position of any satellites passing over your home in the next five days. The map menu (running down the left-hand side) tells you at what time tonight satellites can be viewed while flying over your location. It also allows you to view the locations of all the satellites passing your location over the next five nights.

And the magic doesn't stop there! See a Satellite Tonight also shows the tracks of all visble satellites overlaid on top of a Google Maps Street View panorama of your home. This means that you now know exactly when and where to look in the night sky if you want to see passing satellites with the naked eye.

Monday, April 29, 2024

Weather or Not

Weather or Not's temperature map of the US

Do you dream of the perfect vacation weather? Sunshine on the beach, crisp mountain air, or vibrant fall foliage?  Imagine a tool that helps you find the ideal destination for your desired climate, anywhere in the country and for any month of the year.  This is the promise of Weather or Not, a new interactive map that leverages average weather data to recommend the best time to travel to any location. 

Weather or Not promises to help you discover the best time of the year to travel to different parts of the US if you want to experience your ideal temperature conditions. Enter your ideal temperature range (eg 60-80 Fahrenheit) into Weather or Not and the map will color every US county based on the time of year when you are most likely to encounter your ideal weather conditions in that county.

If you are planning a vacation then you can use the map to find which counties will most likely fall within your perfect temperature range in the month that you wish to travel. Select a month from the drop-down menu and change the view option to 'Yes/No'. The map will then color each US county based on whether it is likely to fall within your ideal temperature range in the month that you wish to travel. 

animated map showing average daily temperatures across the US over the counrse of one year

We all have our own ideas about what the ideal weather conditions actually are. myPefectWeather is another interactive map which can help you find the locations in the United States which most closely match your own preferred temperatures, precipitation levels and /or amount of snowfall.

If you select the 'options' button on the myPerfectWeather map menu you can begin to discover the locations across America which most resemble your ideal climate zone. For example - if you select 'the average high temperature' filter then you can enter your desired range of maximum temperatures. The map will then adjust to visualize the places that most closely match your preferred temperature range. 

You can also filter the map by average daily precipitation, average daily snowfall and comfortable weather days. You can also view a detailed breakdown of the annual weather conditions in any city by using the map's search box.

US map colored to show the number of days in the year that each location is likely to experience temperatures between 40 & 80 degrees

The Goldilocks Zone Finder is an interactive map which can also help you find the location in the United States which has your perfect year-round temperatures. Just tell the map the hottest and coldest temperatures that you are happy to live with it and it will show you a map displaying the number of days per year which fall within your own personal Goldilocks temperature zone, for all locations across the United States.

The Goldilocks Zone Finder was created by Luke Champine who wanted to find a place to live which fell within his own personal temperature preferences. The map uses data from NOAA's 30 Year Climate Normals, which uses 30 years of weather measurements taken across the United States to calculate daily temperature averages. The NOAA Climate Normals also includes averages for precipitation and other climate variables but these are not included on the Goldilocks Zone Finder.

Saturday, April 27, 2024

The US Heat Risk Map

map of the USA showing areas with possible extreme heat

A new interactive map has been released to help warn Americans of extreme temperatures. The new HeatRisk map provides a weekly forecast of the lower 48 states showing where temperatures may be high enough to harm people's health.

On the HeatRisk map areas are colored to show the forecast risks of extreme heat, using a color ramp that proceeds from green (little or no risk) to magenta (rare and/or long-duration of extreme heat). If you click on the map you can also view the forecast high and low temperatures for each day of the next week at that location.

You can also access the HeatRisk map on the CDC website. The CDC map includes a search option to get a weekly HeatRisk forecast for your zip-code area. The CDC’s map also includes links to guidelines on preparing for extreme heat and how to stay safe in high temperatures. The CDC's Heat and Health Tracker is another useful resource. This tracker includes a map showing the current rate of emergency department (ED) visits associated with heat-related illness across the US.

If you are affected by extreme temperatures then you might also want to bookmark the US government's National Integrated Heat Health Information System. This agency also provides a map of current heat forecasts as well as an EMS HeatTracker Map (showing where Emergency Medical Services are currently seeing an increase in heat related emergencies).

Thursday, April 25, 2024

Six Free Alternatives to GeoGuessr

I am a huge fan of GeoGuessr, but unfortunately without becoming a paid subscriber it is now a very limited game. I don't blame GeoGuessr for developing its subscription model. The Google Maps API isn't cheap and I'm sure Google sends GeoGuesssr huge invoices every month. However that does mean there is a huge potential market for a free Street View game. A market that OpenGuessr now hopes to exploit.

Wikidata Guessr

a photo of the Deutschhaus in Mainz and a small inset world map

Let's start with the hardest challenge! Wikidata Guessr is a fun game which involves trying to identify the locations shown in images randomly selected from the Wikidata knowledge base. 

The only problem with Wikidata Guessr is that identifying the locations depicted in still images can be incredibly difficult. The difficulty level of Wikidata Guessr means that I would personally start with some of the other GeoGuessr games listed on this page, especially if you are a novice GeoGuessr player. 

If you are a GeoGuessr pro then you will probably love the challenge posed by Wikidata Guessr. If you do find Wikidata Guessr challenging then you might find some of the thematic rounds (such as parliament buildings, rollwercoasters or mountains) a little easier to play.

Backdrop

a screenshot of backdrop showing the painting of a town square nest to an map of Europe
Backdrop is probably the best game ever devised in the history of mankind (full disclosure - I developed Backdrop myself, so I may be a little biased).

Backdrop is a map based game which is somewhat similar to the very popular GeoGuessr game. However in Backdrop instead of Google Maps Street View images you have to identify the locations depicted in famous pictures painted by some of history's greatest artists.

In GeoGuessr you can stroll around in Street View to pick-up clues as to the location that you have been dropped in. In Backdrop if you don't immediately recognize the scene depicted in the painting there are only a couple of clues available to you. Usually the title of the painting is a huge clue as to the location that is depicted. If that doesn't help then the name of the gallery where the painting is located might be a clue as to the location shown in the artwork (although it might also be a complete red herring). 

Each game of Backdrop involves identifying the locations of 5 paintings chosen at random. You win points based purely on how close you click to the correct location.

You might also enjoy Backdrop.Tripgeo, a series of GeoGuessr type games that I have developed with Tripgeo. These individual games require you to identify the locations depicted in other types of images, these include vintage photos, postcards, movie stills, satellite images and even holiday snaps. 

OpenGuessr

screenshot of OpenGuessr showing the Hagia Sofia in Istanbul

Very much like GeoGuessr the new OpenGuessr is an online geography game that uses Google Maps Street View images to drop players in random locations around the world. Players must then use the clues from their surroundings to guess where they are on the map. The closer their guess is to the actual location, the more points they earn. 

The 'open' in OpenGuessr very much refers to being open or free to play. The game itself is not open-source and it doesn't use open-sourced map data or panoramic imagery. In fact like GeoGuessr the new OpenGuessr game uses Google Map's proprietary data and imagery. Which does make me wonder how long OpenGuessr can survive itself before it will have to start charging users to play.

TimeGuessr

If you are looking for other free alternatives to GeoGuessr then you might also enjoy TimeGuessr. TimeGuessr is another very similar game to GeoGuessr - except in TimeGuessr you are asked to identify the location shown in a photograph rather than the location of a Google Street View panorama. 

As the name 'TimeGuessr' suggests this game also comes with an additional requirement. Like Geoguessr this game requires you to guess a location by dropping a pin on an interactive map, however in TimeGuessr you are also required to guess the time, or rather the 'date' when the image was captured. For me the extra dimension of time in TimeGuessr actually makes it more fun to play. Now as well as using the visual clues to try to determine where in the world a photograph was taken you also have to use the same visual clues to work out in what year the picture was captured. 

Cityguessr

screenshot of cityguessr showing a street view of a rainy street in Bristol

GeoGuessr fans should also have no problem understanding how to play Cityguessr. In Cityguessr you are shown a Street View panorama of a random city. All you have to do is identify the city using the visual clues (street signs, street furniture, architectural signs etc) within the Street View images. 

In most cities you can explore a little by using the arrow signs in Street View to move yourself around. However you only have 135 seconds before you have to make a guess. Unfortunately sometimes Cityguessr gives you a user submitted Street View and you are unable to explore - which can make identifying the correct city very difficult. It's still fun to try though and if you do guess right it makes it even more satisfying.

City Guesser

City Guesser is a fun location guessing game, which requires you to identify a location revealed in a video and point to it on an interactive map. 

The game shows you a random video of someone walking around a city or a famous monument. You have to pick up on the visual clues in the video (such as the languages & words used in street signs and the design of the street furniture) to identify where you think the video was shot. Once you have made your guess you just need to click on the location on an interactive map and you are awarded points based on how close you got to the real location. 

There are a number of different games that you can play. You can choose to view videos just from one country - or you can play either a Worldwide or Europe game - featuring videos from across the world or from just within Europe.

The Stunning Beauty of Air Traffic Data

a map of flight paths in and out of Denver Airport

The ADS-B Massive Visualizer allows you to query and visualize the world's air traffic data. Using the visualizer you can query 50 billion flight data records, enabling you to:

  • map the flight paths of different types of aircraft anywhere in the world
  • visualize the flight patterns of military aircraft
  • track police aircraft
  • observe the effect of war on civilian airline flight paths

These are only a few examples of the hundreds of different types of queries that you can make with the ADS-B Massive Visualizer. The map itself comes with a number of predefined queries that hint at the huge number of possible queries that you can make with the visualizer. 

If you want to format your own queries then you will need to refer to the visualizer's GitHub page, specifically the section titled Database and Queries. The project's GitHub page also includes a large number of screenshots of mapped queries made using the visualizer. These screenshots may give you lots of other ideas about how you can query the database.

map showing the flightpaths of helicopters in London

The possible queries seem endless and hugely fascinating. For example this query of helicopter flights over London shows that many helicopter pilots like to follow the river Thames, as far as the Isle of Dogs in the East End where they turn northwards and then follow the River Lea up through the Olympic Park (or vice versa if traveling in the opposite direction.

map of helicopter flight paths in New York City

One reason why helicopters may follow rivers while flying through cities is to avoid all those tall buildings. For example in this query you can see that in New York helicopters avoid the city's massive skyscrapers by following the Hudson and East River.

Please let me know in the comments if you find any other interesting queries. You can just grab the URL of the ADS-B Massive Visualizer to share the map of your query with the world.

Via: Quantum of Sollazzo

Wednesday, April 24, 2024

America's Drunkest Counties

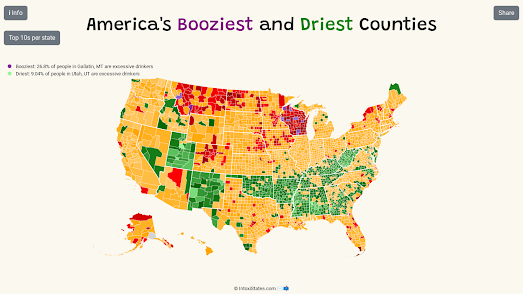
chorpleth map of USA showing levels of excessive drinking in each state

America's Booziest and Driest Counties is a choropleth map which shows the percentage of the population in each US county who are excessive drinkers. The map is based on data from the Centers for Disease Control and Prevention (CDC), which defines excessive drinking as either binge drinking (men 5 drinks in a single session, women 4 drinks in a single session) or heavy drinking (men drinking more than 15 drinks in a week, women drinking 8 drinks in a week).

The map shows that many of the driest counties are also some of the most religious. For example Utah, whose population is over 50% Mormon, is one the direst states on the map. Consequently Utah has some of the most restrictive laws related to the buying and selling of alcohol. Much of the bible belt also seem to have some of the driest counties in the USA.

At the other end of the scale most counties in Wisconsin have a very high percentage of excessive drinkers. The reason for this may be partly cultural and partly due to the state alcohol laws (in Wisconsin people under the legal drinking age may be served, possess, or consume alcohol if they are with a parent, legal guardian, or spouse who is of legal drinking age).

Kentucky and West Virginia both have a large number of very dry counties. I read an interesting theory last week (I can't remember where so unfortunately I can't credit this) that this may be related to the heavy use of opiates in these states (West Virginia has the highest rate of deaths from drug overdose of all states).

The CDC has also mapped out the percentage of excessive drinking by state. The CDC ranks each state based on the percentage of the population who reported binge or heavy drinking. Utah, Kentucky and Alabama respectively top the rankings with the least percentage of heavy drinkers. North Dakota (50), Montana (49) and Iowa (48) have the highest number of excessive drinkers (Wisconsin comes in at 47th).

Tuesday, April 23, 2024

Mapping a Global Coral Bleaching Event

an animated GIF of ABC News' globe of global coral bleaching

Last week the National Oceanic and Atmospheric Administration (NOAA) reported that the 'world is currently experiencing a global coral bleaching event'. The Earth has experienced 10 consecutive months of global heat records,  and in the last year the average global temperature has exceeded pre-industrial levels by 1.58C. These unprecedented sudden rises in air surface temperatures are having a devastating effect on the world's coral reefs.

When the oceans get too warm, corals expel the algae that live within them. This algae provides the corals with vital nutrients and without this algae the corals turn white or pale and are much more susceptible to disease and death.

Australia's ABC News has mapped out the extent of coral bleaching in coral reefs around the world. A 3D globe in The Great Ocean White-Out visualizes the current level of risk to coral reefs. The map uses the reef bleaching alert scale to show the level of risk to individual coral reefs.  The map shows that coral bleaching is now a global problem and, according to ABC News, "For the first time ever, coral (is) bleaching on both the Atlantic and the Pacific side of Panama at the exact same time".

In NOAA's announcement of a Global Coral Bleaching Event the agency reports that this is the second global bleaching event in just the last ten years. NOAA suggests that this "global event requires global action". Which is in itself extremely worrying as the world's governments seem unwilling to even meet the voluntary emissions targets that they set themselves in the 2015 Paris Agreement on climate change.