Tours from Above Luckily it is the weekend, which means you can probably afford to have your attention consumed by Tours From Above.
Tours From Above is a showcase for some of the world's best aerial panoramic photographers and some of the most amazing 360 degree panoramas you will ever see. The site uses Google Maps to show you the locations of aerial panoramas. These panoramas allow you to view oceans, forests, waterfalls and some of the world's cities in a way that you have never seen them before.
It is truly breathtaking to view New York's skyscrapers in a 360 degree panorama taken from the air. If you get bored of New York you can use the Google Map to fly over to Zambia to view a gorgeous panorama of the Victoria Falls from above.
I'm not going to waste any more of your time talking about Tours From Above. You are going to need all the time you can spare to view these amazing panoramas. So, go visit!
Save the Rain This Google Map can help you calculate how much rain water you can harvest from your property. One way to prepare for the effects of global warming on water supply is to capture rain water running off of roofs. This process is known as rainwater harvesting. The rainwater can then be used to flush toilets, and, even do laundry.
Save the Rain can help you calculate how much rainwater your roof could capture. This is done by simple calculating the area of your roof, and, multiplying by the mean yearly precipitation.
To use the map just enter your address and then find the satellite image of your house. Once you have identified your house all you have to do is draw around your roof and press 'finish'. Save the Rain will then calculate the area of your roof, the amount of water you get in a year and how much water you could harvest.
Also See
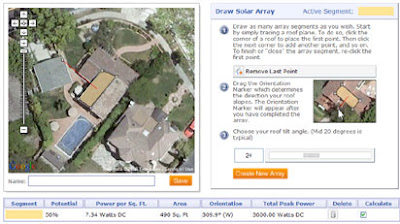
Roofray Have you ever thought about adding solar panels to your house? Roofray can help you decide. Roofray is an amazing tool built on Google Maps that can calculate the solar energy potential of your house.
To do this you start by simply tracing a a polygon on top of the Google Map satellite image of your house. When you have traced your roof you then drag a marker on the map to show the direction your roof slopes. The next step is simply to enter the angle of your roof tilt.
Once you have entered your details Roofray calculates your month-to-month photovoltaic output levels based on your coordinates and regional characteristics such as the average weather cycle, cloud cover, surface albedo, and the orientation and area of your solar array.
Over the last couple of days I've been working on trying to copy Microsoft's excellent demo of Street Slide with Google Maps Street View. You can see Microsoft's demo in the video above.
You can view my latest attempt at recreating the effect here.
I've used Jamie Thomspon's Street View Tile Viewer to grab static images from Google Street View to provide the side on views.
For each Street View I've grabbed two static image tiles. You can see which two tiles I've used in the screenshot above. I've then placed the two images side by side and then placed them side by side with two static images from the next Street View and so on down the street.
If you look closely at the static images in my demo you can see that the adjacent Street View images don't stitch together perfectly. If you wanted you could stitch the images together a little better if you worked on them in Photoshop.
If you are better programmer than me you could probably create the static images directly from javascript using nextPanoId to grab the panoId for adjacent Street Views. In this way you could probably create the static image side street view directly from javascript for any location in the world that has Google Maps Street View.
At the moment in my demo if you want to switch back from the Street View to the static side view you need to click the link under the Street View. My next step will be to replace the Google Maps controls in Street View with custom controls. With a custom control for the zoom I should be able to switch to the static view when the user zooms out of Street View (e.g. when the street view = 'zoom:0').
If you want to try any of this yourself you are free to reuse my code.
Bonus Demo - I got a little bored of working on Street View Slide so I decided to use the Street View Tile Viewer to create this little animation of Oxford Street, London.
Visualising Urban Geographies is a project that aims to bring together historical data provided by Professor Richard Rodger with historical maps provided by the National Library of Scotland. The project's examples website provides access to a very large number of historical maps of Scotland, many of which you can view using the navigational tools of Google Maps.
Maps of Edinburgh, 1765-1945 The Maps of Edinburgh section includes 16 historical maps of Edinburgh from 1765 to 1945. Each of the maps has been overlaid on Google Maps. The maps include a transparency tool so it is easy to compare the maps to the Google Map tiles underneath.
ExMap Viewer The Exmap Viewer brings together maps from the National Library of Scotland collection and some useful research tools. Features include: adding your own maps and data; Google Street View; bulk geocoding and integration of the Topocoding API.
It is also possible to set up your own instance of the ExtMap viewer using Google Spreadsheets to store your configuration details. Customisable options include: map start point, map layers; bookmarks. Map and Google Spreadsheets Data Mashup This is a hugely impressive map viewer that allows you to create your own map mashup with the National Library of Scotland's historical maps and your own geocoded data from Google Spreadsheets.
The viewer includes some example Google Spreadsheet data that geocodes information about tenement plaques in the Marchmont area of Edinburgh. If you wish to add your own data you just need the id number from your Google Spreadsheet.
Barclays Cycle Hire Map London's new cycle hire scheme started today. 5,000 bicycles are available for hire from around 400 special docking stations around the UK capital. Transport for London have produced this Google Map showing the location of the docking stations.
You can search for docking stations by address or just zoom the map to a location. If you click on a map marker you can get live data about the number of bikes currently available at that station.
Nestoria Real estate website Nestoria think that a property's proximity to cycle hire stations might play a key role in finding your next home. As such, from today you can find all of the central London cycle hire stations on Nestoria.
If you search for property in London you can now view all the cycle stations near a property on a Google Map.
London Cycle Stations Map I created this map of the cycle hire stations myself for this Fusion Tables tutorial. I've now added the locations of bike shops to the map. So if you don't want to hire a bike you can buy one instead.
The only other map I'm aware of is the Cycle Hire App for the iPhone. The app uses OpenStreetMaps.
GuidebookPlus GuidebookPlus is a Google Maps based index for travel guidebooks.
GuidebookPlus maps the page numbers of all the places in guidebooks, such as those published by Lonely Planet and Rough Guide. For example is you choose 'Lonely Planet: Italy' from the drop down menu and zoom in on Italy you can see the page numbers on the map relating to each location.
GuidebookPlus includes a number of other functions. If you want to buy a guidebook for your travels you can use GuidebookPlus to find which guidebook has the most places described in a certain area.
As well as quickly finding the location of places mentioned in guidebooks you can get the driving directions from one location to another, find accommodation, read Wikipedia articles and show only places of a given type of interest.
Stereoluchtfoto's van Amersfoort uit 1932 In July 1932 a plane flew over the Dutch city of Amersfoort and took 160 stereoscopic aerial photographs. Wessel Spoelder has pieced together 32 of these photographs and created this Google Maps mashup.
So if you have your 3D glasses hanging around after viewing Street View in 3D put them on and check out Amersfoort from above in 3D. If you know Amersfoort you can even search the map by street name.
This is another great Google Map from ab-c media weblab whose panoramic Street Views of churches in Utrecht is one of the most impressive maps I've seen this year.
London to Istanbul by Train One of my life's ambitions is to take the train from London to Istanbul following the route taken by the Orient Express. Guardian journalist Benji Lanyado did just that and has created this video map of his journey.
The map itself is just a simple My Map embedded on The Guardian website. The videos however are top-notch and definitely worth watching. They are even better, in my eyes, for having been uploaded to YouTube with the user name pottsy4england (there are bonus points available for the first person who can explain that name in the comments).
The nearest I have got to realising my ambition is creating this Google Map mashup of the route, The Orient Express, featuring a number of videos of cities along the journey. The map is a couple of years old now but still works OK.
New York City Subways Here is another great example from the New York Times of a Google Map created to help illustrate a news story.
Every year, New York City Transit releases a station-by-station breakdown of ridership on the network. This NYT article examines which subway stations experienced a decline in traffic last year and which subway stations experienced growth.
Readers of the New York Times can use the Google Map to query the data themselves. The map gives a great overview of the yearly rises and falls of traffic and users can click on any subway station to view specific traffic data.
The map includes three main views which can be accessed via the menu at the top of the map. You can view a map of where ridership is down, where ridership is up and view the total traffic for the year. Other New York Times Google Maps
Rally-Maps.com Rally Maps uses Google Maps to show the locations of rallies all over the world. Rally Maps also maps a lot of rally videos.
If you click on a rally marker you can then select to view the rally's route marked out on the map. The route includes indicators to show the start and finish locations, spectator locations, the schedule of races and an elevation profile.
Users of Rally Maps can add their own videos to the maps. They can also add their favourite spectator locations for the different rallies.
Go Mobo Go Mobo allows users to place online and text message orders at their favorite restaurants.
To place an order diners first have to find which Mobo restaurants are nearby. To do this you just need to enter an address or zip-code. Go Mobo then displays a Google Map of restaurants in your location. The restaurants are also listed in the map sidebar, with the address, distance from your location and opening hours.
If you select a restaurant from the map you can then click through to the restaurant's menu and select what you wish to order. Once you have placed your order all you have to do is turn up, collect your food and eat.
Oak Park and River Forest Bike Theft Map I cycle almost daily. My experience is that I have a bike stolen on average every other year. So over the years I've worked out that in the long run it is probably best to buy only the cheapest bikes in London.
I couldn't agree more then with the The Wednesday Journal of Oak Park and River Forest when they say that the "best way to avoid thefts is to be smart and informed". To help residents in this suburb of Chicago keep informed The Wednesday Journal are creating a Google Map each week to show the locations of bikes stolen
The map shows whether bikes were secured or unsecured when stolen and also shows arrests made related to the theft of a bike. Looking at the map there seems to be a cluster of thefts around South Boulevard. My guess is these are bikes mainly left at subway stations on the Green Line.
Zip The Cure Zip The Cure have created an imaginative fund-raising campaign using Google Maps. The idea behind the campaign is to raise $100 in every zip code to fund research to help find a cure for juvenile diabetes.
To claim a zip-code first go to the Zip the Cure Map to find if your area is still available. If your zip-code isn't available you can always grab one that is. Zip-codes that are already claimed are shaded green and those still available are coloured yellow.
Once you have found a clear location you can donate your $100 by PayPal. If you can't afford $100 you can make a general donation of any sum.
Microsoft Research has developed a pretty cool demo of what they are calling Street Slide. I won't bother describing it as you can see it in action yourself in the video above.
Watching the video I couldn't help thinking that you could produce something very similar with Google Maps Street View. I knocked together this proof of concept in about an hour. I think with a few more hours on this and a little help with jQuery you could actually get something that looked and worked very well.
In this second demo I've tried to stitch the images together. This take a bit more work (with Photoshop), so for now I've only got fours Street Views in this example. So to load the Street Views just click on different parts of the image.
Seattle City Light Seattle's Streetlight Tracker is a Google Map shows the locations of all the street-lights Seattle City Light are working on and the expected time for repairs.
The map uses coloured map markers to show the length of time the light is likely to take to be repaired. Green markers indicate the light should be fixed within 10 business days, blue markers should be fixed with 45 days and red markers need major work and will be fixed within 120 days.
If you click on any of the map markers you can view the ticket number of the street-light repair. If you know of any other street-lights not functioning in Seattle you can report the light to be fixed.
ABC7new's Channel Google Map The traditional TV and print media are very keen these days to feature videos and photographs of news events captured by the public. The fact that a large proportion of the population now carry mobile phones with built in cameras means that when something newsworthy happens there is a very good chance that some people on the scene will be taking pictures and videos. The traditional media want those eye witness records.
If you look on the websites of the traditional media you will often find a link to submit your photos and videos. In San Francisco ABC7news have gone one better and teamed up with YouTube to create the ABC7 uReport. ABC7 will use YouTube Direct to collect news footage from people in the San Francisco Bay Area.
Residents of the Bay Area are invited to document the news and events happening where they live, work and play, and to submit those videos via YouTube Direct to the producers at ABC7. ABC7 will then feature newsworthy videos on television (Channel 7 in the Bay Area), on their website, and on their YouTube channel.
The YouTube channel for ABC7 news and their website both feature a Google Map displaying the submitted newsworthy videos. The videos are categorised into 'breaking news', 'events', 'weather', 'Bay Area scenes'.
WikiLeaks War Logs Having spent a couple of days reporting on Google Map mashups of the WikiLeaks War Logs from Afghanistan I thought I'd have a look at the war logs myself on the WikiLeaks site. Lo and behold it looks like WikiLeaks have themselves mapped all of the 75,000 US military reports covering the war in Afghanistan.
The logs are categorised on the WikiLeaks site by Type, Category, Region, Affiliation, Date and Severity. If you click through to view an individual file you can see the location of the reported incident on a Google Map placed at the bottom of the log.
Næsten 4.000 civile dræbt i Afghanistan Danish newspaper Ekstra Bladet has been analysing the WikiLeaks War Logs for references to incidents involving the Danish army. They have created a Google Map interface to their findings showing the locations of the references to Danish soldiers.
The mapped incidents are categorised into Enemy Action, Explosive Hazard, Friendly Action, Non-Combat Event and Other. Each category is given its own category of map marker. If you click on a marker you can read the leaked war log in full.
Each information window also has a permanent link. So if you wish to share a particular war log with someone you can give them the link. When the recipient clicks on the link they will be taken to the map and to the open information window of the selected war log.
I'm Just Walkin' Matt is walking across the USA. You can follow his progress with this Google Map of photographs he is taking of his journey. Currently Matt is in Placid Lake State Park in Montana.
The I'm Just Walkin' website includes two Google Maps, the map of Matt's photos and a smaller map showing his progress so far. Actually the photo map shows a pretty good track of Matt's route - there are a lot of photos. You can browse Matt's photos of his journey directly from the map or you can view them in blog form under the map.
Afghanistan War Logs: IED Attacks Map The Guardian newspaper have created another informative Google Map from the WikiLeaks War Logs from Afghanistan. The Guardian's IED Attacks Map shows the location of 16,000 improvised explosive devices in Afghanistan over 5 years. The improvised explosive device (IED) is the Taliban's weapon of choice.
The map includes an animated timeline. If you press play at the bottom of the map you can watch the data being animated on the map from 2004 to 2009. It is even possible to view what data you wish to view on the map whilst it is being animated. The map includes markers for civilians, coalition troops, Afghan troops and others. You can select to view any combination of the map markers.
On Sunday The Guardian released the Afghanistan: The War Logs Map. The map geotags a selection of 300 of the key intelligence reports from the War Logs.
eBird Gulf Spill Bird Tracker eBird have created this Google Map to show bird sightings in the Gulf of Mexico. The map also displays an oil slick forecast for the next four days.
The oil slick forecast is provided by the National Oceanic and Atmospheric Administration. The bird observations are from eBird's own tens of thousands of users. The bird sightings on the map are indicated by red markers for sightings older than 30 days and yellow markers for more recent sightings.
You can change the bird species displayed on the map by clicking the 'more species' button and selecting one of the available bird species.
eBird Global Range Maps eBird have also created this Google Map that displays a range map for any bird species around the world. There isn't any information available on how the map works but I assume the range maps are created by using the sightings for each species submitted by eBirds users.
To use the map you just need to enter the name of the bird species into the search box. The map will then display a heat map showing locations around the world where the species has been sighted.
Bird Observations Finally, eBird also let you create a point map for any location, or a seasonal grid maps for the Americas for any bird species using Google Maps.
The latest YouTube viral video is this amazing timelapse of someone walking across America.
The video is accompanied by a Google My Map of the route. The map includes behind the scene pictures and videos that were shot on the journey from Brooklyn Bridge to the Golden Gate Bridge.
Anthem Clinic Locator Anthem Blue Cross in Virginia say that more than 60 percent of emergency-department visits by Anthem members are actually for non-emergency medical problems. ER wait times are at an all-time high, so patients with non-emergency problems can actually cause delays in doctors treating real emergencies.
To help their customers find medical care quickly when they can’t see their regular doctor Anthem Blue Cross have created a Google Map of health clinics, walk-in doctor offices and urgent care centers. They hope the map will help reduce the number of visits to ER by non-emergency patients.
The map allows Anthem customers to search by address or zipcode. Health clinics, walk-in doctor offices and urgent care centers are shown on the map by categorised map markers. The information window for each facility contains the full address, opening hours and an option to get driving directions.
Ping London This summer the English Table Tennis Association have placed 100 ping-pong tables in London's squares, shopping centres, estates, offices and train stations. The campaign, named Ping, aims to get a million more people playing more sport by 2012.
So if you are in London and you fancy a game of outdoor table tennis then you should check out the Ping map. The Ping Google Map shows the location of all 100 table tennis tables.
The map sidebar has a nice feature that dynamically loads the nearest table tennis tables to the map centre as you pan the map. The listings in the sidebar also inform you how far the tables are from the current map centre.
This is probably old news to many of you but I just realised that Street View in 3D is still available on Google Maps.
On April 1st this year Google turned Street View into 3D. The Street Views however soon returned to normal and that, I thought, was that. However I discovered today that if you right click on Street View there is an option to turn '3D mode' on.
So if you have a pair of 3D glasses lying around you can now see the world in glorious 3D (it's almost as good as looking out the window).
Storm.no Norwegian weather forecaster Storm.no have produced a route planner that can not only provide you with directions but can also show you the weather along your route.
The service uses the Google Maps API's driving directions service and overlays the weather forecast for locations along the route. When you enter you starting point and destination Storm.no also asks you to enter a date and time for your journey. In this way the forecast weather for the time of your journey can also be displayed on the map.
Norway Green Tours Norway's Youth Hostelling Association has created this Google Maps guide to the west coast of Norway. The west coast of Norway is legendary for its fjords and beautiful scenery. With the Green Fjord Experience you can now plan your trip advance.
The Green Fjord Experience map shows the locations of Youth Hostels on the west coast, towns that you will want to visit and the locations of fjords and glaciers that you will want to see. Each mapped location contains brief details with a link to a fuller description elsewhere on the site.
The Norwegian Trekking Association The Norwegian Trekking Association have produced a very useful Google Map to show trekking routes in Norway.
The map shows all the trekking routes with red or blue lines. The red lines indicate summer routes and the blue lines show winter routes. As well as the routes the map shows the locations of lodges, cabins and emergency shelters.
If you click on a route on the map you can get details of the trek (in Norwegian), including the trek's distance. If you click on a lodge or cabin's map marker you can get details about opening times and the number of bunks provided.
Not For Tourists Not For Tourists is a growing series of guides to major cities around the world featuring Google Maps of local points of interest. The site includes maps for everything from restaurants, night spots, and shopping to parks, public transit, sports stadiums, museums and art galleries.
If you select a city from the drop down menu at the top of the page you are presented with the city guide and a Google Map of the selected location. Many of the larger cities are broken down into separate guides so the initial Google Map presents a number of selectable districts within your chosen city.
The Google Maps for the selected districts present local points of interest. The locations are displayed with categorised map markers so you can tell at a glance which are restaurants, bars, shops etc. If you mouse-over a map marker the name of the point of interest is also displayed.
If you click on a map marker you will be taken to the locations' dedicated page on Not for Tourists. The dedicated page includes details and reviews of the chosen location.
Whereables Whereables is a Google Map of the world's airports. Using the map it is possible to find out which airline flies where and how people rate them. Users of the map can comment and rate individual airports, airlines, the food, the facilities, the queues, the crew...the security or the other passengers.
If you click on one of the mapped airports you can view where you can fly to from that location. All the possible destinations are shown by connecting the airports, as seen in the screenshot above.
Hidden away in the blog (click on the 'b' in the side panel) on Wherables is a link to a fun little airport map game. The game involves clicking on the location of a given airport on a Google Map. This is definitely a game for frequent fliers.
World Intelligence Headquarters Last week the Washington Post released a Top Secret America Google Map showing the location of America's secret privatised national security network. Yesterday The Guardian released Afghanistan: The War Logs Map, a Google Map showing the location of incidents mentioned in US military files in Afghanistan.
Now someone has created a Google Map to show the locations of the headquarters of intelligence agencies, intelligence facilities, SIGINT stations and training centres around the world. I guess it hasn't been a good week for the secret police.
Afghanistan: The War Logs Map On Sunday WikiLeaks released 92,201 records of individual events or intelligence reports from US military files pertaining to the war in Afghanistan. The New York Times, The Guardian and Der Spiegel were all given access to the material several weeks ago. All three publications have now released a series of articles about the leaks. The Guardian has also produced an interactive Google Map.
The Guardian's 'The War Logs Map' geotags a selection of 300 of the key intelligence reports. The paper claims that they "have ensured none includes information identifying intelligence sources or putting Nato troops at risk".
The map is really just a navigation guide to the war logs. The logs are mapped by category; 'accident', 'Afghan friendly fire', 'coalition friendly fire', 'civilian casualties', 'demonstration / unrest' and 'other'. Each map marker contains a link to read the war log in full.
The Guardian have also provided a link to the data behind the map. So if you think you can do better in mapping the data you are free to give it a go.
London Cycle Stations Map On the 30th July London is launching a Cycle Hire scheme. Under the scheme people will be able to hire bikes from 400 docking stations situated throughout the capital.
Transport for London are preparing a Google Map showing the location of the 400 docking stations. TfL say the map will go live on the 30th July (at the moment the map is empty). If you can't wait until then check out the map I created for this Fusion Tables tutorial.
The only other map I'm aware of is the planned Cycle Hire App for the iPhone. The app will use OpenStreetMaps when it launches.
Create an Isochrone Map Isochrone maps show travel times from a given location. Most isochrone Google Maps allow the user to select a location and then see how far they can travel in a set time from that destination.
One of the best isochrone maps built with the Google Maps API is the London at Night map.
The London at Night map shows how long it takes to get to anywhere in London by night bus.
If you would like to create your own isochrone map then a good place to start is the Flying Memes tutorial. The Flying Memes isochrone map uses the directions service to search for points that surpass a given time limit from the given location.
Drought Timing for Agronomic Screening This amazing Google Maps mashup plots the probability of observing a drought stress after any given sowing date for anywhere in the world.
If you click on the map an information window opens giving a summary of the FAO soils available at that location. Users can choose values for the critical Ea/Et for drought, days after sowing and period in canopy closure. You can then run an analysis on the selected location.
The analysis shows the probability of drought for the selected number of days after sowing. It is also possible to observe the mean Ea/Et values for the number of days selected.
GoogleCompass GoogleCompass is a great Google Maps tool that enables users to plot and record compass bearings, distances and magnetic declination or variation for single or multiple routes.
Once you choose between plotting a single-leg or multi-leg route GoogleCompass presents a Google Map with an interactive Silva compass, which is automatically adjusted for differences between magnetic and true north for any location on Earth.
Once you have plotted a route with GoogleCompass it can be saved and stored for later retrieval.
The GoogleCompass application is a brilliant tool for geography teacher, orienteering enthusiasts and hikers wishing to practise compass reading and plan routes from the comfort of their classroom or armchair.
The LAN Party Map At a LAN party computer owners meet and set up a local area network (LAN), mainly in order to play multiplayer computer games. The LAN Party Map is a new Google Map to show the locations of upcoming LAN parties.
To find a LAN party near you, you can zoom in on a location or you can select a state from a drop down menu. If you click on a map marker you can view the name of the event, the day it starts, the price and a link to more information.
Registered users can add upcoming LAN parties to the map.
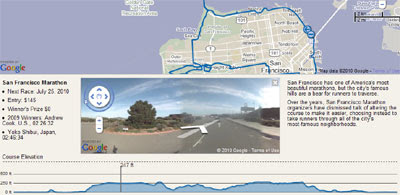
Going the Distance - The Wall Street Journal The Wall Street Journal have created a Google Map of this Sunday's San Francisco Marathon. The map includes the route, an elevations chart and Street Views of the route.
This in itself would be very impressive but the Walls Street Journal wasn't satisfied so went ahead and mapped the Boston Marathon route, the New York Marathon and the Chicago Marathon as well. Each of them also come with elevation charts and Street View.
My favourite feature of the Wall Street Journals maps is the superb integration between the elevation chart and Street View. If you hover your mouse along the elevation chart the Street View will update to show the respective view. Very cool.
Also See
Skyhook Experience Skyhook Wireless have created a Google Map of San Francisco to show where people congregate during different times of the day. The map has been created for this Sunday's San Francisco marathon.
My own London Marathon Street View map now looks very tame in comparison. Don't worry though when I get a spare hour or two I'm going to take up the challenge laid down by the WSJ.
Bistro Chaser Bistro Chaser provides a real time tracking Google Map for food trucks in Los Angeles, Orange County and New York. The map uses Twitter messages from the food trucks themselves to provide updates of their current location.
If you select the Schedule section of Bistro Chaser you can select a city and a specific food truck. You can then view the schedule for the selected food truck. The different locations that the truck is planning to visit are shown on the map and listed in the map side panel.
The last thing the world needs is another location sharing mobile application. However Tagwhat does have a unique selling point. TagWhat isn't just another location sharing application, it is an augmented reality location sharing application.
If you download the Android or iPhone TagWhat application you can then use your mobile phone to share your location with the rest of the world. Your message can then be viewed by other TagWhat mobile users in augmented reality in their phone screens.
As well as appearing in augmented reality your message will appear on the TagWhat real-time animated map of location check-ins. The TagWhat home page features a prominent Google Map that animates through the latest messages sent by TagWhat members.
Mais Gasolina This Google Maps mashup allows you to find the price of gas at Portugal's gas stations.
The initial view shows 120 gas stations but as you zoom in on a specific area all the gas stations will load. You can also search for gas stations around a location by using the map search box.
To find out the various gas prices at a station just click on its map marker.
The Alleghenies Interactive Map The Alleghenies are home to some of the best fishing in the eastern USA, countless miles of hiking trails, rushing white-water rivers and peaceful lakes. In fact there are so many outdoor activities possible in the Alleghenies it is difficult to know where to begin. That's where this Google Maps guide to the Alleghenies great outdoors comes in.
The Alleghenies Interactive Map helps you find ATV & dirt biking trials, bird watching locations, cycling on road, hiking trails, motor touring and mountain biking trails. For each mapped activity users can share their comments and photos of the location.
Mapping Out the Google Maps Office The Google Geo team's new office in the Googleplex has been decorated by artist Christoph Niemann. Christoph's work is inspired by Google Maps, as you can see from the screenshot above. The artist's work was also recently featured in the New York Times.
Street View Lens Flares I know that your life has been missing a blog dedicated to Street View images that feature lens flares. Thankfully your life can now be complete as StreetViewLensFlare has been released and yes it is a blog dedicated to Street View lens flares.
Skyhook Experience Skyhook Wireless have created a Google Map of San Francisco to show where people congregate during different times of the day. The map has been created for this Sunday's San Francisco marathon.
By creating s heat-map of where mobile phone users are located (based on the wifi signals within range) Skyhook are able to give a pretty accurate overview of current hotspots in the city. The map includes a slider that allows you to select different times during the last couple of weeks (up to about two hours before the current time).
Skyhook Wireless have another example from this year's Boston Marathon. The example highlights location lookups along the Boston Marathon route on a Google Map. These lookups are displayed alongside a Google Map showing the previous Monday's activity, demonstrating the increase in human activity in the area due to the marathon.
Schmaps Pro Accounts Schmap.it is a platform to share events and places easily on Twitter. For example, if you are holding a conference, you can create a Schmap.it page that will show the location of the conference, via a Google Map, and also display all the latest tweets about the conference.
Schmap.it have now released a PRO version of this popular app, with an enhanced feature set. What's more to mark the release of Schmap PRO, between now and July 31 Schmap.it are giving away 10,000 two-year PRO accounts: